Basic Software Tools: Machine-Independent Graphics | Common Lisp Modules: Artificial Intelligence in the Era of Neural Network and Chaos Theory
About
是的, 我需要一点点上古遗物. 本来打算从 CLIM 2 Spec 开始看,
然后写一个类似的东西 (或者写一个 backend), 但是看了几页之后就直到自己太菜了,
(对 GUI 的 API 完全没有什么概念, 更不要说如何去实现了)
所以现在先建立在已有的 McCLIM 或者 clim-tos 的基础上, 快速的做一些简单的 GUI 先.
或者能不能用类似于 CLOG 的框架呢?
这里参考的是 Common Lisp Modules: Artificial Intelligence in the Era of Neural Network and Chaos Theory 一书, 你应该可以在网络上找到它的扫描版. 之后还想要读一点后面的部分.
Interface
(defpackage #:cl-module/plot
  (:use :clim :clim-lisp)
  (:export #:init-plot
           #:plot-fill-rect
           #:plot-size-rect
           #:clear-plot
           #:pen-width
           #:plot-frame-rect
           #:plot-line
           #:show-plot
           #:plot-string
           #:plot-string-bold
           #:plot-string-italic
           #:plot-mouse-down))

(in-package :cl-module/plot)
原文中使用的是 Macintosh Common Lisp (现在我也没法搞到能运行的 MCL 了, 就连模拟器都跑不了… 这让我比较痛苦面具). 所以估计得要重新全部重写了.
我现在使用的是 CLIM-TOS, 理论上你可以用 McCLIM, 但是我的电脑上有一个报错
(Unknown &KEY argument: :MAX-MEASURE-WS). 虽然我的建议是用 McCLIM,
因为它仍在被更新, 并且有相对更加好看的界面, 并且 BUG 也会少一点.
另一个需要注意的事情是: 由于原本的程序是面向于 MCL (大概是 PPC 甚至之前的 Macintosh 机器), 所以对色彩非常的保守 (用的是 5 阶灰度). 所以会做一些简单的修改.
所以简单来说, 就是这个代码是建立在 CLIM 2 标准 (CLIM-TOS), 参考 Common Lisp Modules: Artificial Intelligence in the Era of Neural Network and Chaos Theory 一书中的 Chapter 2 进行构建的.
Implementation
Utils
Plot Frame
(define-application-frame plot ()
  ()
  (:panes
   (display :application
            :min-width 100 :min-height 100
            :width     400 :height     400))
  (:layouts
   (:default
    (vertically () display))))

(define-plot-command (com-quit :menu t) ()
  (frame-exit *application-frame*))

(define-plot-command (com-clear :menu t) ()
  (window-clear (get-frame-pane *application-frame* 'display)))
Quick Wrapper Macro
(defmacro with-in-plot-pane ((pane &key (coordinate :origin)) &body body)
  "Bind var `pane' with `*plot-frame*' display pane.
  The `coordinate' could be:
  + `:origin' (default) for top-left corner positioned
  + `:local' for centered positioned"
  (if (eq coordinate :local)
      (alexandria:with-gensyms (w h)
        `(let* ((,pane (get-frame-pane *plot-frame* 'display)))
           (multiple-value-bind (,w ,h)
               (window-inside-size ,pane)
             (with-translation (,pane (round ,w 2) (round ,h 2))
               ,@body))))
      `(let ((,pane (get-frame-pane *plot-frame* 'display)))
         ,@body)))
General Impelement
;; The global plot window object
(defparameter *plot-frame* nil
  "The graphic frame to plot.")

;; Initialize a standard plot window
(defun init-plot (&key (width 400) (height 400))
  "Creates a graphics window, return a window stream."
  (setf *plot-frame*
        (make-application-frame 'plot :width width :height height)))

(defun show-plot (&key (background t) (name "PLOT"))
  "Open the `*plot-frame*' window."
  (unless *plot-frame*
    (warn "Plot not initilized yet, auto inited.")
    (init-plot))
  (flet ((run () (run-frame-top-level *plot-frame*)))
    (if background
        (bt:make-thread #'run
                        :name name
                        :initial-bindings
                        `((*default-server-path* . ',*default-server-path*)))
        (run))))

(defun clear-plot ()
  "Clears the graphics window."
  (window-clear (get-frame-pane *plot-frame* 'display)))
Graph Methods
;; Colors: use CLIM color system

;; Graphing Settings
(defparameter *default-pen-width* 1
  "Default pen witdth (unit by px).")

(defun pen-width (px)
  "Sets the pen drawing width."
  (setf *default-pen-width* px))

;; Graphing Methods
(defun plot-fill-rect (x y xsize ysize color)
  "Fills a rectangle with `color'."
  (with-in-plot-pane (pane)
    (draw-rectangle* pane x y (+ x xsize) (+ y ysize)
                     :ink color :filled t
                     :line-thickness 0)))

(defun plot-size-rect (x y xsize ysize max-width &key (color +black+))
  "Plots a rectangle with `max-width'."
  (let* ((width (min xsize max-width))
         (scale (/ width xsize)))
    (with-in-plot-pane (pane)
      (draw-rectangle* pane x y (+ x (* scale xsize)) (+ y (* scale ysize))
                       :line-thickness 0 :ink color))))

(defun plot-frame-rect (x y xsize ysize
                        &key (color +black+) (pen-width *default-pen-width*))
  "Plots a framed rectangle."
  (with-in-plot-pane (pane)
    (draw-rectangle* pane x y (+ x xsize) (+ y ysize)
                     :line-thickness pen-width
                     :ink color
                     :filled nil)))

(defun plot-line (x1 y1 x2 y2
                  &key (color +black+) (pen-width *default-pen-width*))
  "Plots a line between two points."
  (with-in-plot-pane (pane)
    (draw-line* pane x1 y1 x2 y2
                :line-thickness pen-width
                :ink color)))

(defun plot-string (x y str &key (size 10))
  "Plots a string at position (x y)."
  (with-in-plot-pane (pane)
    (draw-text* pane str x y :text-size size)))

(defun plot-string-bold (x y str &key (size 10) (color +black+))
  "Plots a bold string at posistion (x y). "
  (with-in-plot-pane (pane)
    (draw-text* pane str x y
                :text-face :bold
                :text-size size
                :ink color)))

(defun plot-string-italic (x y str &key (size 10) (color +black+))
  "Plots a italic string at posistion (x y). "
  (with-in-plot-pane (pane)
    (draw-text* pane str x y
                :text-face :italic
                :text-size size
                :ink color)))
Inputs
;; Inputs
(defun plot-mouse-down ()
  "Returns position of mouse click."
  (with-in-plot-pane (pane)
    (tracking-pointer (pane)
      (:pointer-button-press
       (event)
       (return
         (values (pointer-event-x event)
                 (pointer-event-y event)))))))
这里我感觉到 CLIM 的爽了, 实现一些功能随便糊糊就可以实现了, 并且还可以有比较细致的控制… 不过感觉 CLIM 的缺点就是实在是太大了, 没有一个很好的, 非常全面的入门文档来介绍. 明明能够处理的事情也很多, 从底层到高层都可以, 甚至整体的体验还很统一, 可惜没有一个好的推广啊.
虽然有点怀疑我这么糊真的可以吗? 管他呢.
Test
(defun test ()
  (init-plot)
  (show-plot)
  (clear-plot)
  ;; The XQuartz on my macos need some delay time to boot?
  #+darwin
  (sleep 0.1)
  (flet ((gray6 (level) (make-gray-color (/ level 6))))
    (dotimes (i 6)
      (plot-fill-rect  (* i 9) (* i 9) 8 8 (gray6 i))
      (plot-frame-rect (* i 9) (* i 9) 8 8))
    (dotimes (i 100)
      (plot-size-rect (+ 160 (random 200)) (random 100)
                      (1+ (random 10)) (1+ (random 10))
                      (random 5)))
    (dotimes (i 4)
      (plot-string (* i 10) (+ 150 (* i 22))
                   "Mark's plot utilities..."
                   :size (* (1+ i) 5)))
    (plot-string-bold 20 260 "This is a test... of BOLD" :size 20)
    (plot-string-bold 20 300 "This is a test... of ITALIC" :size 30)))
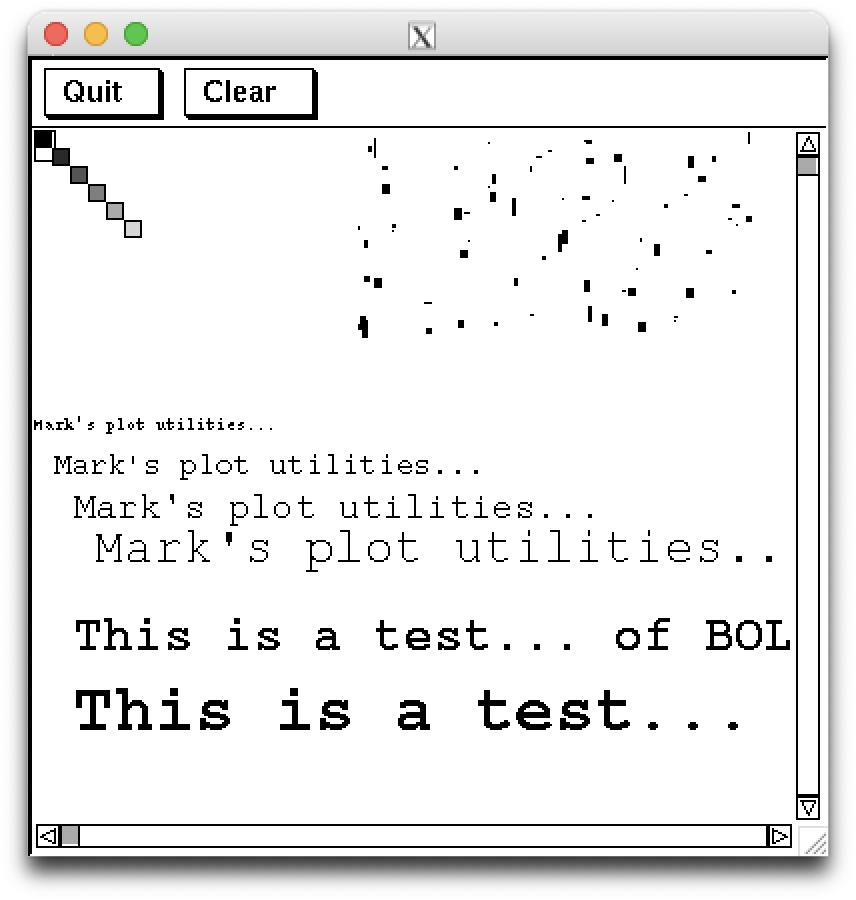
啊… 不知道是不是字体缺失导致斜体和粗体没法正常显示, 但是做到目前这样大概就好了吗?
结束
大概就是这样, 你应该可以在 plot.lisp 这里下载全部的代码. 至于 clim-tos,
可以通过 git clone https://gitlab.common-lisp.net/mcclim/gramps-clim2.git,
放在 ~/quicklisp/local-project/ 下, 然后通过 quicklisp 载入.
那么让我们看看之后会有什么样的操作吧.
更新
看到第二章就觉得可能会有点不太够用了, 并且因为平时也需要用, 所以写了一个简单的绘图库 GURAFU.